
Small is the new big
It’s Small Charity Week again! Last year we did an analysis of small charities in Lambeth and Southwark and examined the grantmaking patterns.
This year, thanks to our new 360Insights platform, we decided to go big and explore grantmaking to small charities across the whole of the UK in 2018. For the purposes of this analysis, we used the Small Charities Coalition‘s definition of small charities – those with an annual income of less than £1m.
In this blog, we share some findings from our research and then guide you through how we did it in case you’d like to try it for yourself.
What is 360Insights?
Launched earlier this year, 360Insights combines grants, postcode, company and charity data to help grantmakers more easily understand their funding activities through simple visualisations.
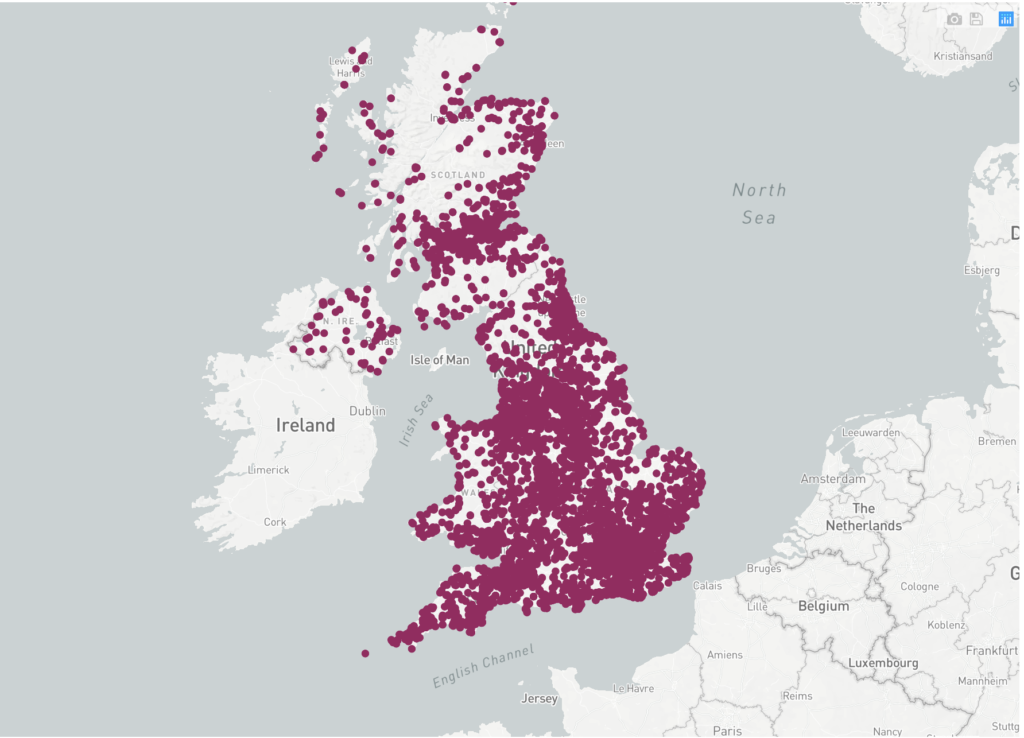
For individual grantmakers it answers questions like how much is given to different types of organisations and when, how old and how big these recipients are. And it’s the first time you can instantly see grantmaking on a map.
360Insights can also visualise data from multiple grantmakers, using a GrantNav search, and that’s what we’ve done here.
What did we find?
For our research we looked at 360Giving data covering 2018. Of the 14,954 grants awarded to charities in that year, we found that 11,615 were to small charities – that’s 77%. In terms of amount awarded though, small charities received £284.1m out of £498.5m, which is only 57% of the total.
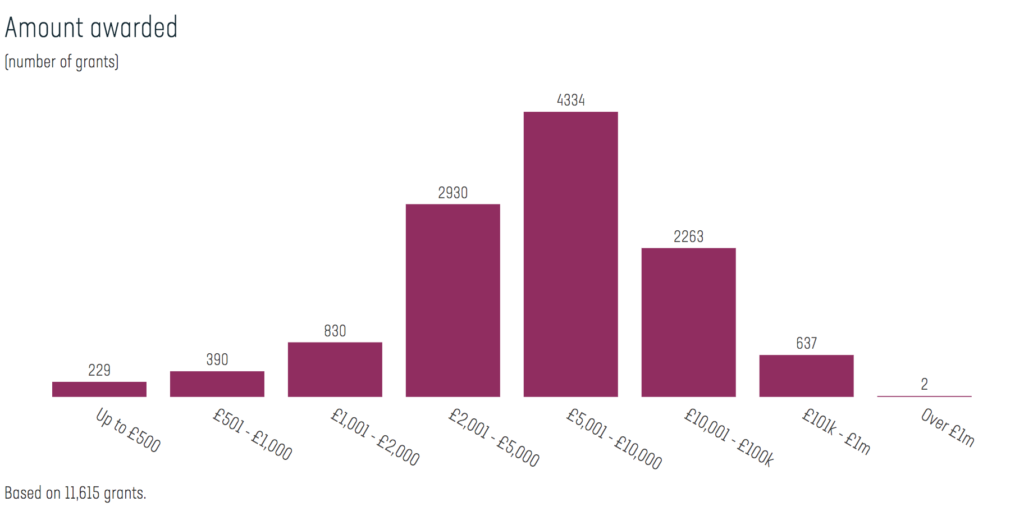
Amount awarded
The majority of the grants (58%) awarded to small charities were for £10k or less.
Where are the small charities that receive grants?
The leader in our dataset is Scotland, with 14% of the grants awarded to charities registered there. London follows close behind with 13% of the grants, followed by the South East with 11%.
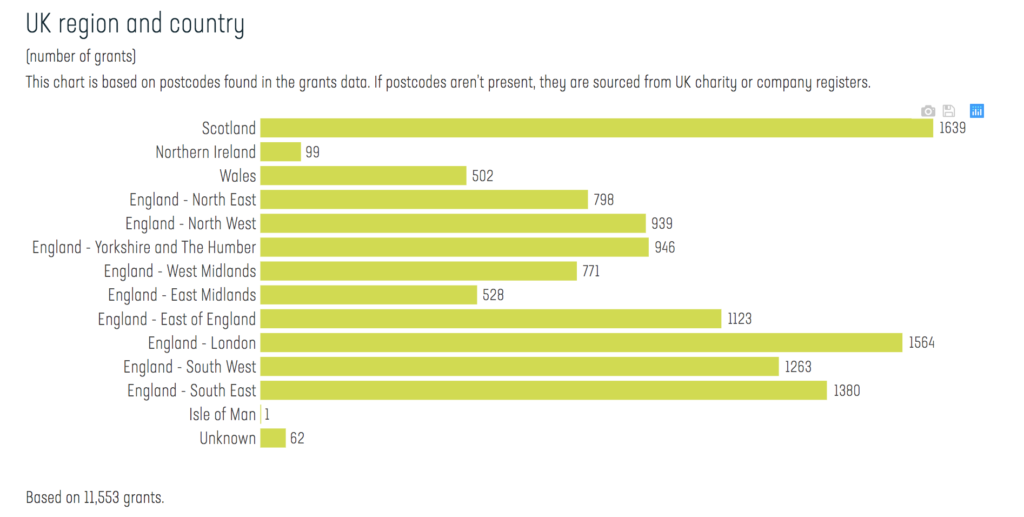
But generally, small charities are registered all over the UK – from the Shetland Islands to the Isles of Scilly!
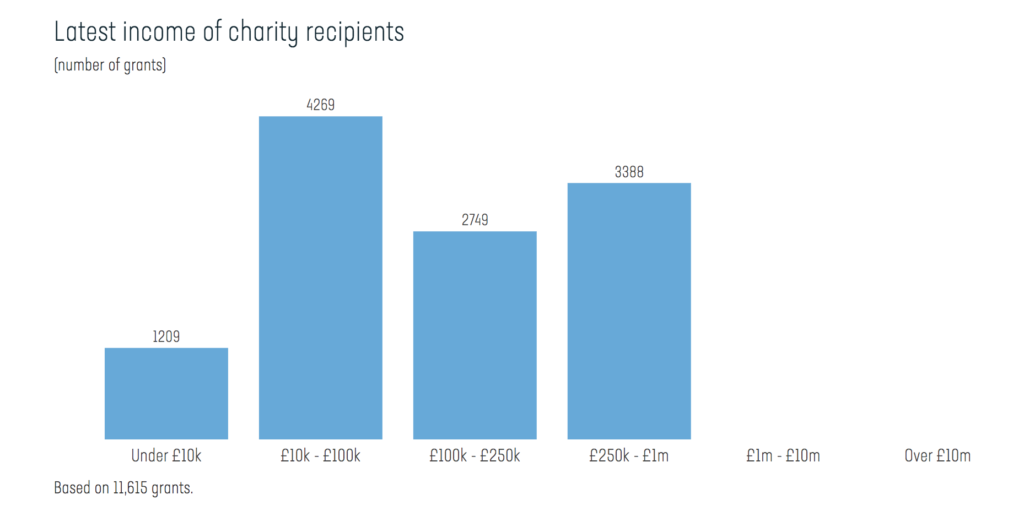
How big are small charities?
According to the dataset (which combines Charity Commission and 360Giving data), 47% of small charities have an income of £100k and below. Micro charities (£10k and below) form 10% of the dataset.
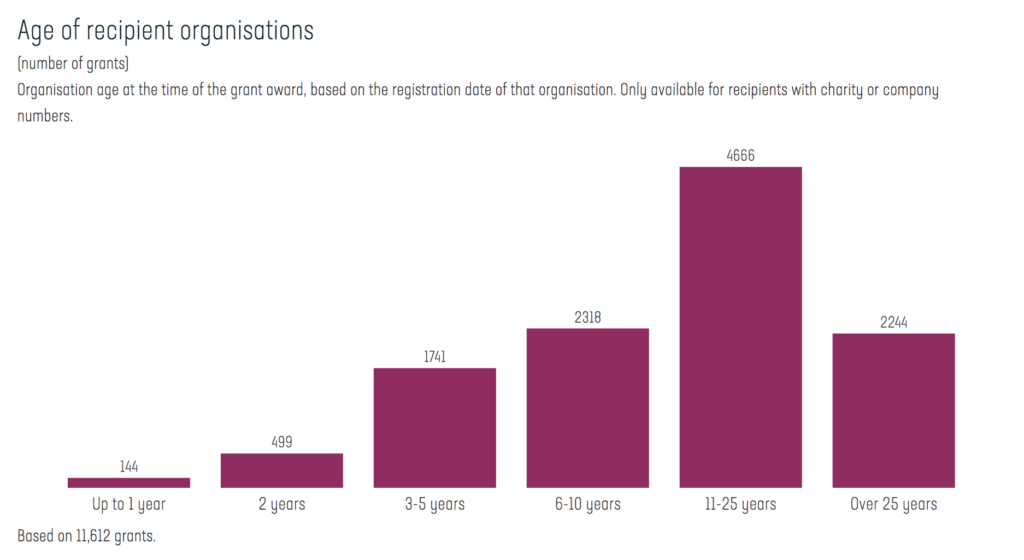
How old are small charities?
It seems like older, more established small charities still get the majority of the grants. Only 40% of small charities are 10 years or younger, and the majority category is between 11-25 years.
How we did this research, and how you can do it too
Step 1 – Download the data from GrantNav
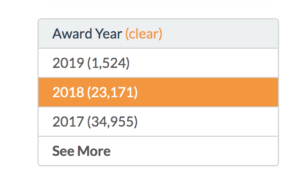 On the GrantNav home page, make a blank search (simply don’t type anything in the search, just press enter). Then, in the results page, go to the award year and click on 2018. You will now see 23,171 grants (for June 2019 GrantNav data). Download the results into a CSV file.
Step 2 – Upload the GrantNav file to Excel / Google Sheets and filter for charities
As we want to examine charities and the dataset covers grants awarded to other types of organisations such as companies, schools and unregistered community groups, we used the Recipient Org:Charity Number field, and filtered on it so it will only show grants with an entry in this field. That left us with 14,967 grants, which is 63% of the 2018 total. Copy the clean filter results into a new file and save it.
Step 3 – Upload the new file to 360Insights
In 360Insights, click “Upload a file”, and select the file you saved. (When uploading to 360Insights, you will see that there are now 14,954 – that is because some of the grants had invalid charity numbers, so 360Insights omitted them for us.)
Now, let’s filter to see what funding small charities are receiving.
Step 4 – Filter on organisation size
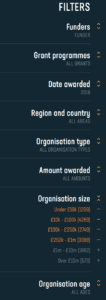 The organisation size shows you the latest income of charity recipients. At the filters on the left hand side, click on “Organisation size” and choose the following categories – Under 10k, 10k-100k, 100k-250k, 250k to 1m. This will return a search with all the charities with a turnover of under £1m.
Here’s one we prepared earlier
If this all sounds too complicated then you can follow this link where we’ve already uploaded the 2018 data.
Why don’t you investigate more?
Using the upload file you can play with the filters in 360Insights and see what funding has been awarded to small charities by region.
Or you can download the raw data from 360Insights and run your own analysis that might help you get to know your local funding landscape in even more detail.
Please let us know what you find out.