
My first data visualisation brought clarity on how on-target our funding is
“We thought we were sharing data for the benefit of grantees, but now we realise that it benefits us too”
When we heard that Patrick O’Kelly of the Clothworkers Foundation had been inspired at an event by a data visualisation, and saw how he’d created his own using 360Giving data, we invited him to tell us more…
 360Giving:
Hi Patrick, thanks for talking with us. So, why did you make a data visualisation?
Patrick O’Kelly:
I’ve always been interested in understanding our reach as a national funder of disadvantaged communities. But we don’t have the capacity to do much outreach, and we’d only been using traditional spreadsheets and graphs.
As an early supporter of 360Giving, we believe in open data sharing. At a recent ACF event I saw some visualisations – a 360Giving chord diagram and a map – that were built using a platform called Flourish. I went away inspired by the power of ‘dataviz’ and wanted to impress on our trustees how data can help us with our grantmaking and how important 360Giving has been to funders understanding their own data.
So, back at the office I was keen to see if a visualisation could help me find out two things – firstly whether we are reaching the majority of regions, i.e. hitting the whole of the UK. And secondly, to check if we are reaching disadvantaged communities.
360
How did you create your visualisation?
Patrick
I didn’t have any knowledge or experience of using data or making visualisations. But given what I saw at the event, I signed-up to Flourish, and found it has pre-existing mapping for the UK, broken into constituencies.
It took me a couple of days of researching how to use it with our data, mostly just watching guides. There were a few steps, some of which were a little fiddly but not complicated-fiddly.
I was pretty happy with my first attempt, visualising our 2017 data by postcode, and had gained the confidence to improve it with a second version that mapped our 2018 data to Super Output Areas. This was a little trickier because I needed to change the postcodes to coordinates and bring in deprivation data from other sources to fill-in some gaps.
I found it really interesting, and not complicated once I’d figured it out! And now I’ve got a template to build from.
360
What does your visualisation show?
Patrick
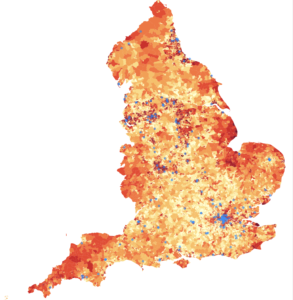
Essentially it shows a map of our Open Programme grantees overlaid on Super Output Areas ranked by deprivation.
360
What did you learn, what insights does it reveal?
Patrick
The visualisation has brought three main insights.
Crucially it reveals the deprived areas where we haven’t supported any organisation. So this is new information for our trustees to assess and decide if we need to do anything about that.
We can now also see that we are funding some organisations that aren’t in deprived areas, and so we will need to analyse that as there may be good reasons, such as grantees supporting people with disabilities. As a capital funder we award grants for equipment and buildings – quite tangible things – so we are fairly confident that we are benefitting the areas where the recipient organisations are based.
We will explore the implications of these insights over the coming year.
Finally we can take heart – as the visualisation shows that we do okay, as a grantmaker with limited resources. It shows that in 2017 two thirds of grants reached 50% most deprived areas, and the majority of our grants are to the most deprived areas. Our 2018 data shows a similar trend.
So it has helped us to check that what we are saying as a foundation is consistent with how we are actually awarding grants. And it gets us thinking and having ideas, based on easy to understand information.
360
What conversations has the visualisation prompted?
Patrick
We were already impressed with 360Insights, a helpful platform that demonstrates the value of collating different open datasets. Our trustees saw how useful it can be, for example showing that we tend to fund organisations which have been operating for longer even though that’s not part of our eligibility criteria.
Now that we have visualised our grants data alongside deprivation, it’s much easier to communicate with our trustees about how we are delivering on our strategic objectives and how we could move forward.
It’s still early days but it’s already spurring conversations and more importantly it really got through to our trustees how data can help shape future grant making. At a more practical level, we could also look at how we are communicating to applicants about what we expect from them to make the funding process easier.
360
What do you want to do next with data?
Patrick
Actually it’s pretty rewarding to have got this far so easily! Now that we have such clarity around how our grantmaking is integrated with our mission of serving disadvantaged communities, from this point we can dig a little deeper. I can play with the data more confidently using Excel and visualisation tools, exploring the deprivation gaps mentioned earlier and perhaps looking at population density.
From supporting 360Giving early on, it’s great to see only a few years down the line what can be achieved. We thought we were sharing data for the benefit of grantees, but now we realise that it benefits us too.
And if even I can fairly easily make sophisticated ways of communicating our activities simply, the potential for other grantmakers is clear!
360
Thank you very much Patrick.
Are you using 360Giving data to make better decisions? Please tell us about it.