
Poverty and reduced statutory funding in Trafford
7 September 2018
In this blog series, participants in the 360Giving Data Journey share their learning and experience.
Bethan Rowsby is the grants administrator at Trafford Housing Trust providing administrative support to the rest of the Social Investment staff team as well as all to volunteers, including Social Investment Board, Virtual Committee and Community Mentors.
I wanted to join the data expedition as we are a place-based funder located in Trafford, so the local level focus of the Data Journey was particularly relevant to us. Our aim is to eliminate poverty and inequality in Trafford, therefore we are interested in the outcomes our grant recipients will achieve with the grants we award. Currently we are looking at areas to prioritise within our fund, whether that be location, age group, or a particular need. We are also trying to identify gaps in provision or gaps in linking people to provision in Trafford.
Personally, I was interested in how we can use data to inform our decision making, particularly in identifying gaps in current services. I had done some work with James Austin at the Trafford Data Lab, who has helped us to provide a clearer overview of funded projects in Trafford by using the same 360Giving prefix “360G-trafford” for both our grants and Trafford Council’s grants. This made me realise how data, when created and kept ‘clean’ and standardised, can be used to identify patterns of funding. I wanted to use this Data Journey to discover how data can be used most helpfully and beneficially to make informed decisions regarding funding.
Here’s what Bethan found
My question was: “Where are the poverty related gaps in Trafford due to reduced availability of statutory funding?”
 My main challenge was combining data to answer this question – grants awarded published using 360Giving and deprivation data for Trafford. I found 215 grants to the voluntary, community and social enterprise (VCSE) sector in Trafford between 2017-2018. There was missing data with only 75 of these grants having ward data, and there was also an assumption is that there is only one beneficiary location which may not necessarily be the case.

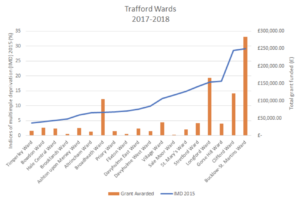
I visualised the income deprivation against the grants awarded to each ward in Trafford, to understand how much grant support each ward gets and whether there was a correlation between the two. The ward with the most grant support in 2017-2018 was Bucklow-St. Martins, which was also recorded as the ward with the highest percentage of deprivation in 2015.
What I learnt
- It is important to use data to give a more detailed picture, for example breaking down Trafford into its wards to see the difference at a more localised level. However, it was also noted that whilst these wards exist, they are not always used by people to refer to where they are from.
- Two extremely useful Excel functions are: VLOOKUP and Pivot Tables – very helpful for organising and presenting data
- My next steps would be to think about how I can use this data, and also expand the data source for grants given at a ward level, or another localised level.