
Social Life’s Community Dynamics Data
Building neighbourhoods where communities can flourish in the long term is as important as designing places that are economically and environmentally sound. How can the success and progress of communities be measured and evaluated over time?
Social Life has developed a new way to understand local communities through the use of data – we call this Community Dynamics Data. Using our social sustainability framework, and drawing in national survey data, we map predictive data about how people feel about the neighbourhoods they live in. This data offers valuable insights into residents’ sense of belonging, local relationships, local satisfaction and perceptions of safety.
Data about this lived, day-to-day experience of local residents is often missing from decision-making processes. Through Community Dynamics Data, Social Life aims to complement the wider sets of data more commonly used by local agencies (e.g. deprivation, crime, public health) to better understand life in neighbourhoods.
This predictive data reveals insights that may inform the design of proposals for new developments, regeneration work on existing neighbourhoods, or plans to implement new services or projects. We are then able to compare actual data about residents’ perceptions to what we would expect it to be, giving us an assessment of how well the area is faring. Or highlighting which areas are likely to have good relationships between different groups, while others have less cohesive communities. Social Life’s research team often uses this data as a starting point, from which further on-the-ground research can be undertaken to explore the themes highlighted.
Exploring these kinds of questions can help everyone involved in shaping neighbourhoods– from residents, to community groups, charities, through to councils, housing associations and housing developers make better decisions about local neighbourhoods. For the funders engaging with 360Giving, the data could also help to explain, at least partially, funding coldspots and hotspots.
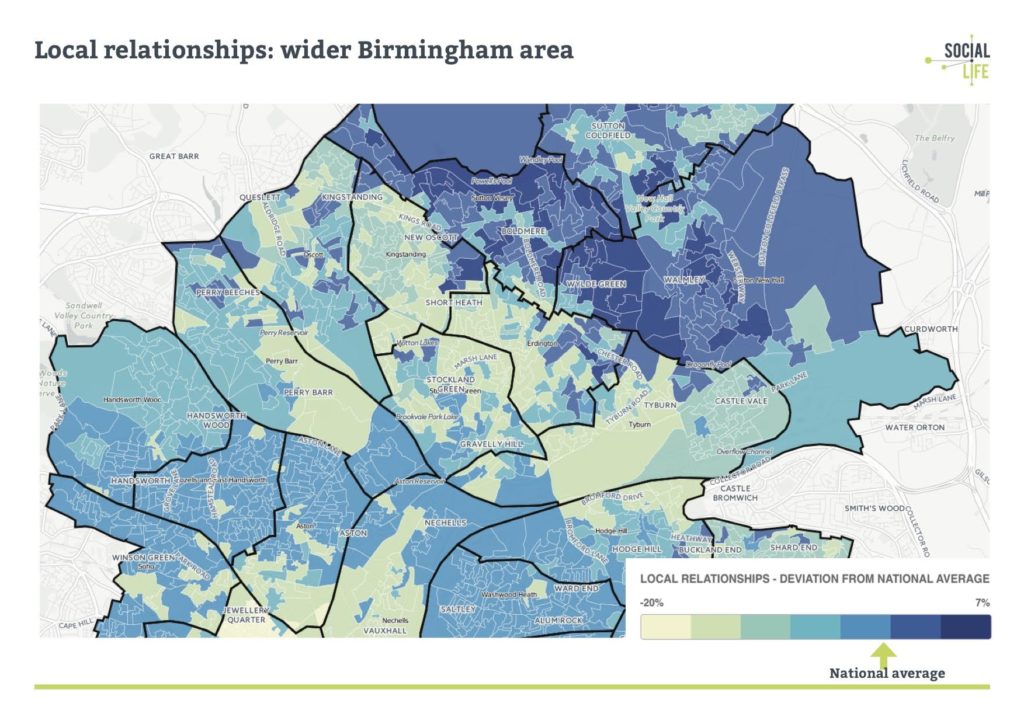
Uniquely, this data offers very localised insight. More commonly used datasets about very local areas, such as the Index of Multiple Deprivation, tend to not be available below ‘Lower-layer Super Output Area” (LSOA) level. However, using a method developed by the Office of National Statistics – “Area Classifications” – which categorises small local areas by demographic and socio-economic characteristics, we are able to map people’s predicted subjective experience of where they live down to very small areas, “Output Areas”.
Social Life often use Community Dynamics Data as a starting point in their work with clients, who are interested in finding out more about the strengths of communities in specific neighbourhoods. These clients are keen to gain a better understanding of communities affected by their work and, in doing so, want to take a more assets-based approach to working in those areas. Social Life’s team can provide further research in that locality to explore and test the issues indicated by the data – providing a more thorough picture of the community’s dynamics. If you are interested in finding out more about the work Social Life is doing, please get in touch with their team.