
A Question of Geography…
How many times have you said “I wish we knew who was funding what in our area?”
Maybe you’ve even been that brave volunteer who offered to try and pull the data together from whatever other group members could supply – and then regretted it. At 360Giving, one of the many reasons we are passionate about encouraging charities to publish their grant-making data to our standard is because it will make that process a lot simpler.
There are now 33 funders publishing data– from The Big Lottery with 163,000 grants to One Manchester with 66. To show people what you can do with all that information we built GrantNav, just one tool that helps people uncover the stories the data can tell. This month, we caught up with funding and capacity building officers who’ve been exploring how that works.
Dipali Chandra from Charitable Trusts West Midlands, contacted the office for help with using the data in GrantNav to look at grants being awarded at ward level. After explaining some of the inner workings of the tool, we asked her what being able to access the data meant for her work. “It’s about having the conversations we’ve never been able to have before” Dipali said. “we literally used to say that we can’t discuss these questions because we don’t know anything”.
Of course, there are still limitations – GrantNav’s filtering function uses the grant recipients’ address to locate the funding, rather than the project location and many funders haven’t included this kind of information in their data yet. But with a GrantNav data report including volume funders like The Big Lottery, BBC Children in Need and Comic Relief as a starting point, the much-needed conversations were launched.
Dipali also put us in touch with Austin Rodriguez, from the Neighbourhood Development and Support Unit at Birmingham City Council. Austin describes himself as a self-taught spreadsheet wrangler. He pulled data from 360Giving data together with other information supplied directly by funders and compared it with local public sector data profiling the population and needs. From this he was able to put together a report to advise the Partners Investing in Neighbourhoods & Communities group on how they were doing at getting funding into some of the most deprived wards in Birmingham.
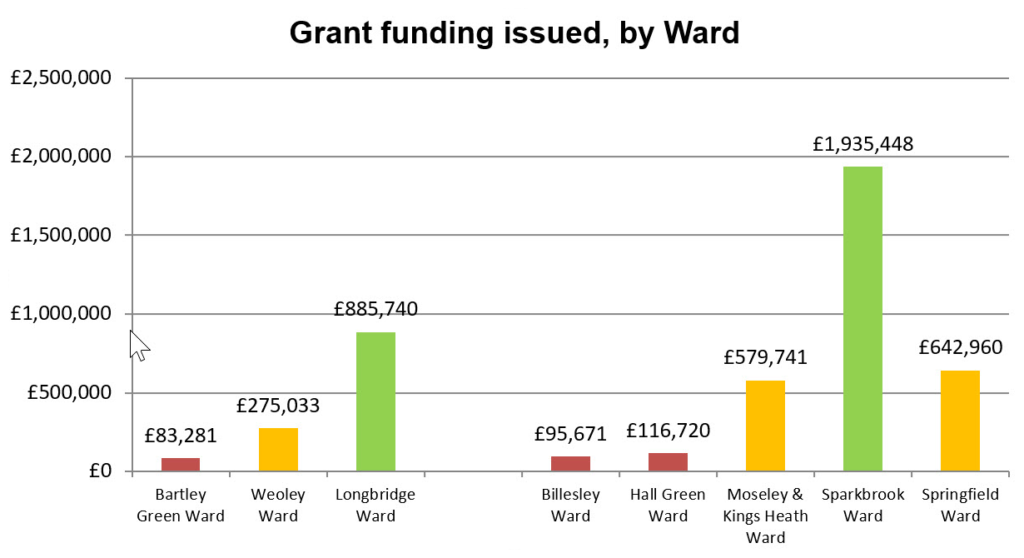
Graph showing amount of grant funding by ward created by Austin Rodriguez, Birmingham City Council
Austin was excited by the data because it helped him to question assumptions and provide insights about how well joined up things are (or aren’t). The myth that grants were going to only the usual suspects was debunked by the numbers (101 grants, 81 recipients). Then the data supported a strong correlation between the spread of grants across different wards, and the number of established community organisations in those wards. It also highlighted areas of significant underinvestment, compared to need and assets, as well as insights about dependency on grants.
These are just the first reports we’ve had back in to the office about how data is being used in the capacity building and fundraising sector to support decision making and learning and we’re looking forward to hearing more over the next few months.
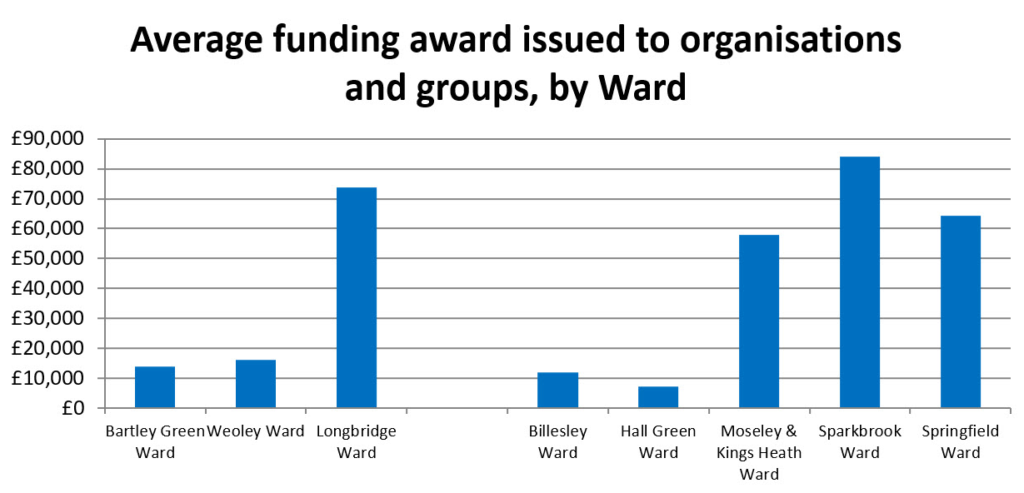
Graph showing average grant size by ward created by Austin Rodriguez, Birmingham City Council
If these stories intrigue you, what can you do?
If you’re a bit of a data dabbler – no need to be an expert – you might like to look at our top tips for working with 360Giving Standard data and geography so you can explore some patterns and trends emerging in your area.