
Putting local charities on the map
By Leigh Dodds, Mark Owen
Bath: Hacked is a volunteer-led open data project serving the community of Bath & North East Somerset. We run a data store to collect and share local data, and work with local organisations, including the council, to help explore the benefits of open data for our community. We host hackdays, run training sessions and try to build interesting and useful things using local open data.
A lot of the work we’ve done this year has involved making maps. Maps are great ways to visualise data. Taking data locked up in spreadsheets and putting it on an interactive map creates a whole new perspective.
To showcase some of our mapping work we’ve been running a “Data Advent” again this December. We’ve been sharing a new or interesting data-driven map every day.
We often find that to understand our local area we need data from multiple sources. No single organisation has a complete picture. GrantNav does an excellent job of bringing together information on grants that have been awarded around the country.
So we decided to explore whether we could map the data from GrantNav for Bath & North East Somerset.
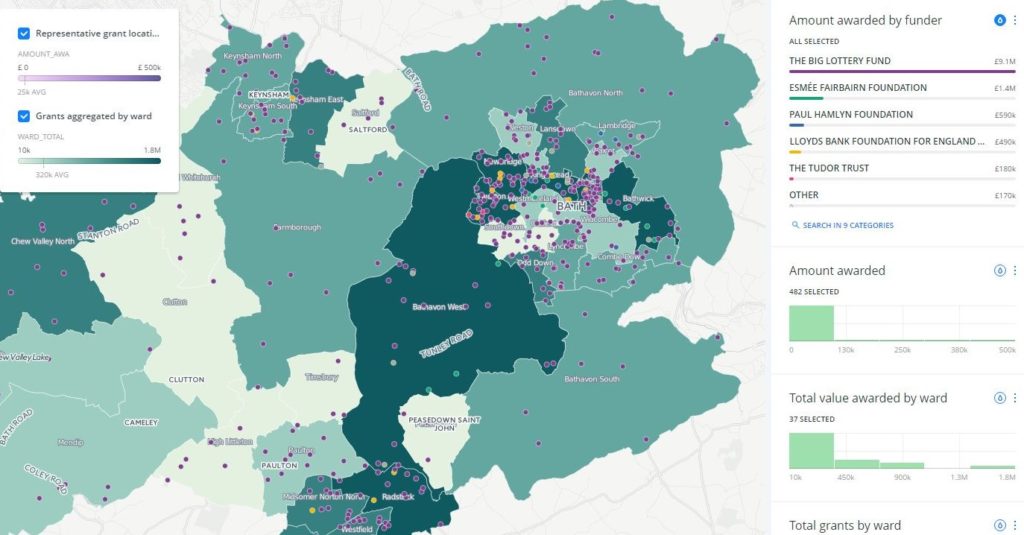
Map of grants awarded to Bath and North East Somerset
Downloading the CSV file from GrantNav showed that the data included the name of the ward in which the project was funded. This was fantastic as that meant that we could build a map showing the level of grant funding awarded within each of the wards in our area.
Our resident mapping expert, Mark Owen did the work to build the map. The first step was to combine the GrantNav data to an open dataset of our ward boundaries, using a desktop tool called QGIS. This gave us a geographic area for each grant and not just a ward name. We then used a tool called Carto to actually create the map. It’s free to use for open data and it can very quickly produce some great interactive maps.
To add a bit of flair, Mark also used some mapping wizardry to assign a geographic location for each project. The points are randomly assigned within a ward and so don’t reflect the actual locations of the projects or grantees. That information isn’t included in the raw data available via GrantNav, which makes sense for privacy reasons. But adding the points helped give a flavour of the number and type of projects running in each ward.
We’re really pleased with the final result.
It’s the first time a map of this type has been built for the local area and it gives a great overview of the range of great local charities and projects that have had funding. We look forward to updating this as new data from GrantNav becomes available.