
Reports, publications and analysis
Through our reports and publications, we aim to inform funders’ decision-making and to inspire practice. We help grantmakers to track trends over time and to gain further understanding of specific issues.
Our reports
UK Grantmaking 2021-22: Snapshot
The analysis provides a consolidated view of grantmaking data across different sectors in a concise and accessible format through interactive visualisations.
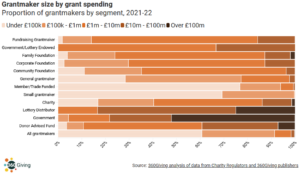 By collating information from multiple funder types, it offers valuable insights into the landscape of funding in the UK, presented together for the first time. This allows for a deeper understanding of philanthropic efforts and by putting these into a wider context, highlights patterns, as well as making it easier to see what further data is needed in the future to provide a fuller account of UK grantmaking.
In addition to this analysis, you can also read more about why we did this, our approach, our learning from this data, our longer term plans and how you can share your views in our blog.
Sector Infrastructure Funding
Voluntary sector infrastructure bodies perform vital roles supporting and enabling voluntary and community organisations, both locally
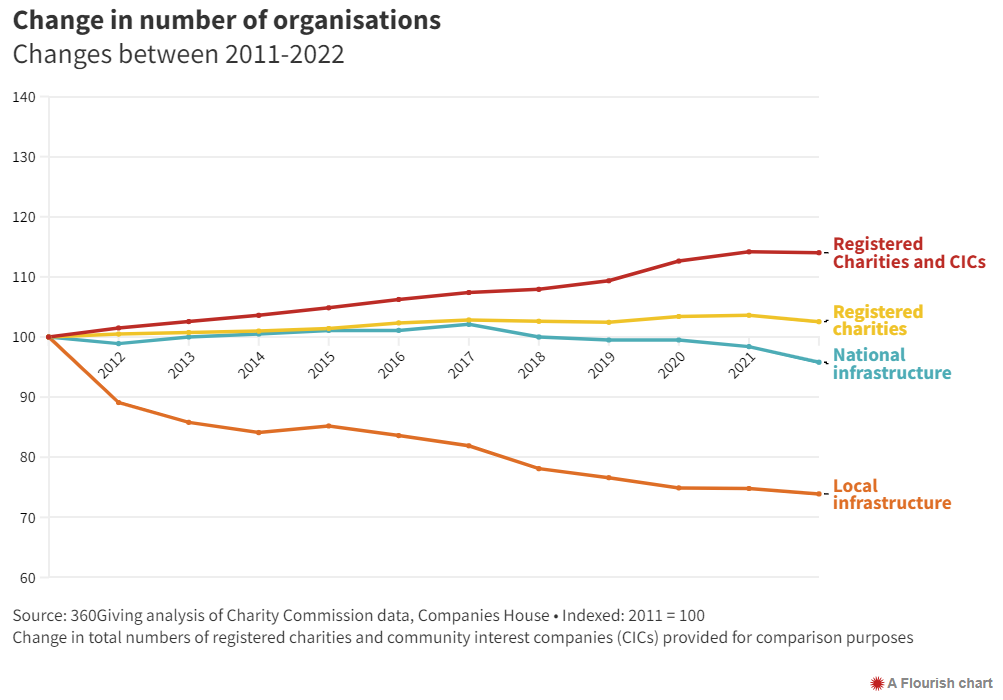 and at a national level. This report explores how the voluntary sector infrastructure has changed over the last 12 years, particularly by looking at its finances and funding. It highlights a number of challenges around funding of these organisations.
The Paul Hamlyn Foundation has commissioned 360Giving to support this analysis as a starting point to facilitate discussions and support more active decision-making in what is likely to be a very challenging period for the sector.
Specialist Legal Advice Providers Analysis
We were pleased to work with the Access to Justice Foundation on a report analysing funding for ‘Specialist Legal Advice Providers’.
Combined with analysis about specialist legal advice providers themselves, we’ve covered the size and scope of the sector, income sources, and lots more information about funders and funding – including the relationship between funder collaborations.
As well as reading the report, you can explore the data in our methodology and we’ve written a blog on ‘Analysing Specialist Legal Advice Providers funding: What can we see? What have we learnt?’ too.
UK Covid relief and recovery grants: data analysis
This report uses data published by funders about the grants they made between March 2020 and October 2021 during the Coronavirus pandemic to understand how they and wider civil society responded during that time.
It aims to be a starting point for the exploration of the data collected on Covid-19 relief and recovery grants. You can click on links on every page to view interactive visualisations to explore the data.
‘Below the Radar’: understanding some of the UK’s smallest charities
Analysis using 360Giving data to find and explore grassroots non-profit organisations operating at the local community or neighbourhood level. Such organisations are vital to UK civil society but often fall ‘below the radar’, and have previously been under-represented in research and statistics. This paper demonstrates the value of data-sharing in bringing them into the spotlight. The report was funded by Local Trust and carried out by 360Giving and NCVO, and to accompany the report we wrote a blog on how we discovered some of the UK’s smallest charities.
Other examples of analysis using 360Giving Data
Data Visualisation Challenge

In 2018, 360Giving invited developers, researchers and anyone with an interest in the data to use our dataset to develop and visualise innovative solutions to key questions facing the grantmaking sector. It provides inspiration and ideas of what can be done with the data.