
How Birmingham City Council is using data to understand funding in the West Midlands
With the Birmingham 2022 Commonwealth Games on the horizon, Birmingham City Council is working to understand what grantmaking currently looks like across the region. Here, Sam Milsom from Open Data Manchester shares how over three workshops he helped the council to better understand who is funding what and where, and where there is potential for future collaboration.
Birmingham City Council recently held a Data Storytelling workshop – facilitated by Open Data Manchester and 360Giving – with funder groups in the West Midlands.
The aim of the workshop was two-fold:
- To get a sense of grantmaking in the West Midlands
- To stimulate discussion around the legacy fund being created by the Birmingham 2022 Commonwealth Games
 This was the third workshop in a series of three that were run in partnership with Birmingham City Council. We used the Data Expedition model developed by 360Giving. The first was a ‘questions definition’ workshop, where we defined research questions that can be answered with data. The second was a ‘data expedition day’. This brought together a diverse group of people from policy, community development and technical backgrounds together in an action-learning environment.
The expedition day explored wide-ranging themes such as community cohesion, digital accessibility, interest in the Commonwealth Games (CWG), and the lifecycle of the voluntary sector. We decided to narrow our focus solely on grantmaking in the West Midlands so we could stimulate further discussion around the CWG legacy fund.
Datasets were prepared in advance and visualised using 360Giving’s 360Insights tool. The session incorporated elements of Open Data Manchester’s Data For Communities workshops, which serve a ‘beginner’s guide to data’, looking at the data that is collected about us and our communities, and some simple tools that help to access and understand it.
We took the findings from the data expedition day and used them to start to build compelling stories for the storytelling workshop.
What we did
After a recap of the previous two workshops, we went back to basics by asking a simple question: what is data? Many participants were used to working with data on a daily basis, particularly in helping with policy and decision-making, but how far did they understand the fundamentals? We used the DIKW pyramid to illustrate where data sits in terms of telling stories: that it can be used as evidence but is rarely an answer in and of itself.
We then explored some of the dangers of working with data, such as being aware of biases or misinterpreting correlations. Using some of Tyler Vigen’s Spurious Correlations and Citylab’s The Bleeding of Chicago, we looked at how important it is to have this awareness – just because the data appears to be telling you one thing, doesn’t necessarily mean it’s true.
We looked at some examples of good storytelling with data – a Vox video, and a blog by 360Giving on grantmaking in London. Then participants started drafting stories based on what the data presented on GrantNav was telling them.
We then introduced participants to 360Insights, looking at grantmaking data across the West Midlands as a whole, and comparing the Birmingham District with the much smaller Sandwell district. The aim was to spark a conversation: did the data corroborate or contrast with funders’ own experiences/assumptions? What is the data telling them?
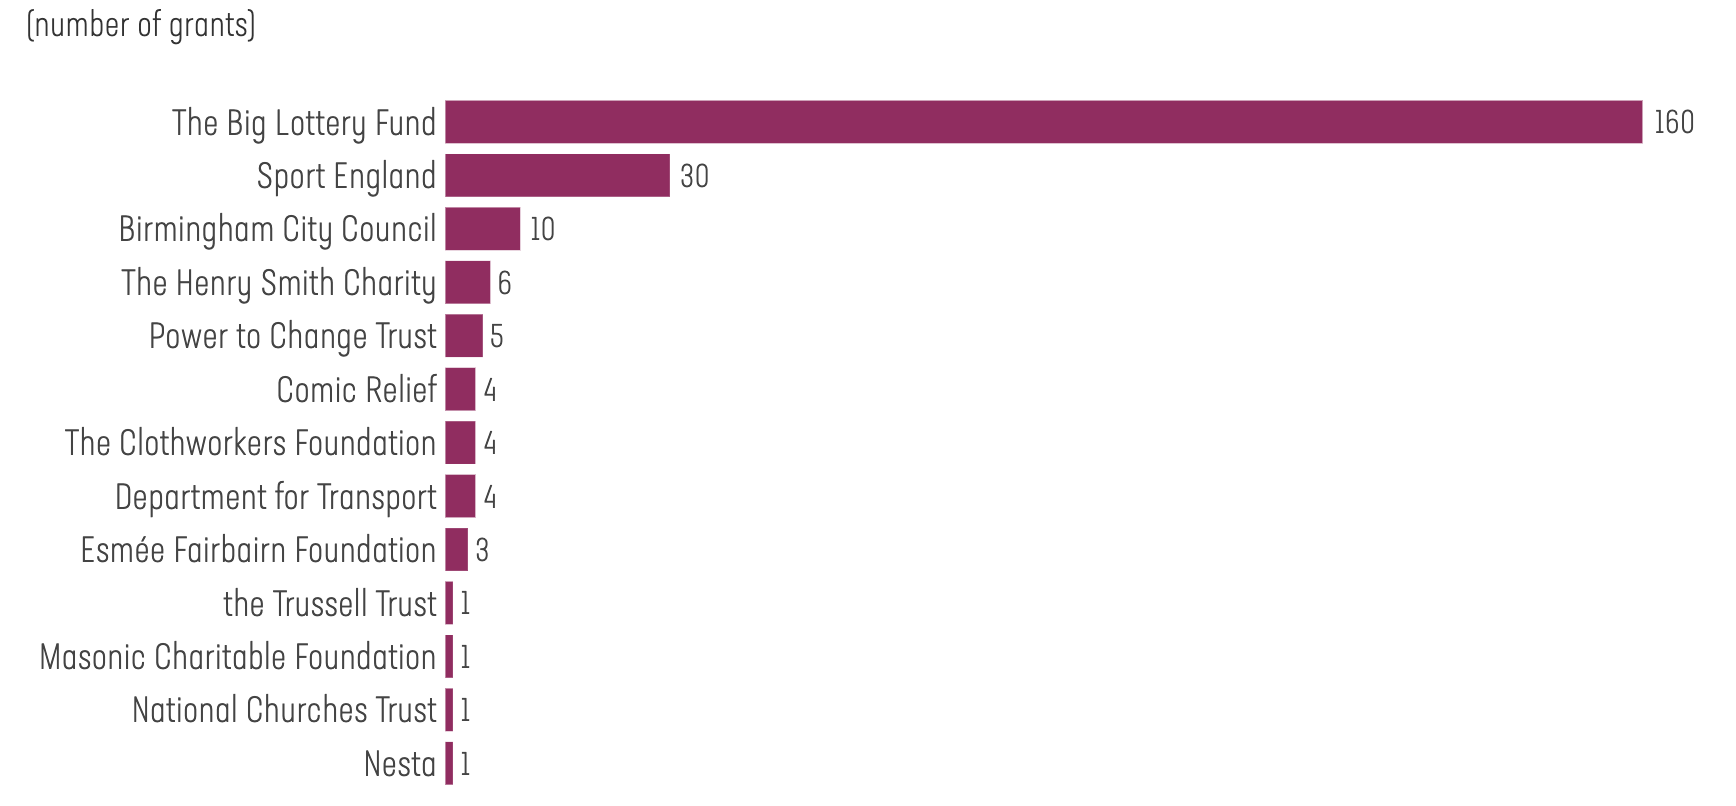
Birmingham (amount awarded)
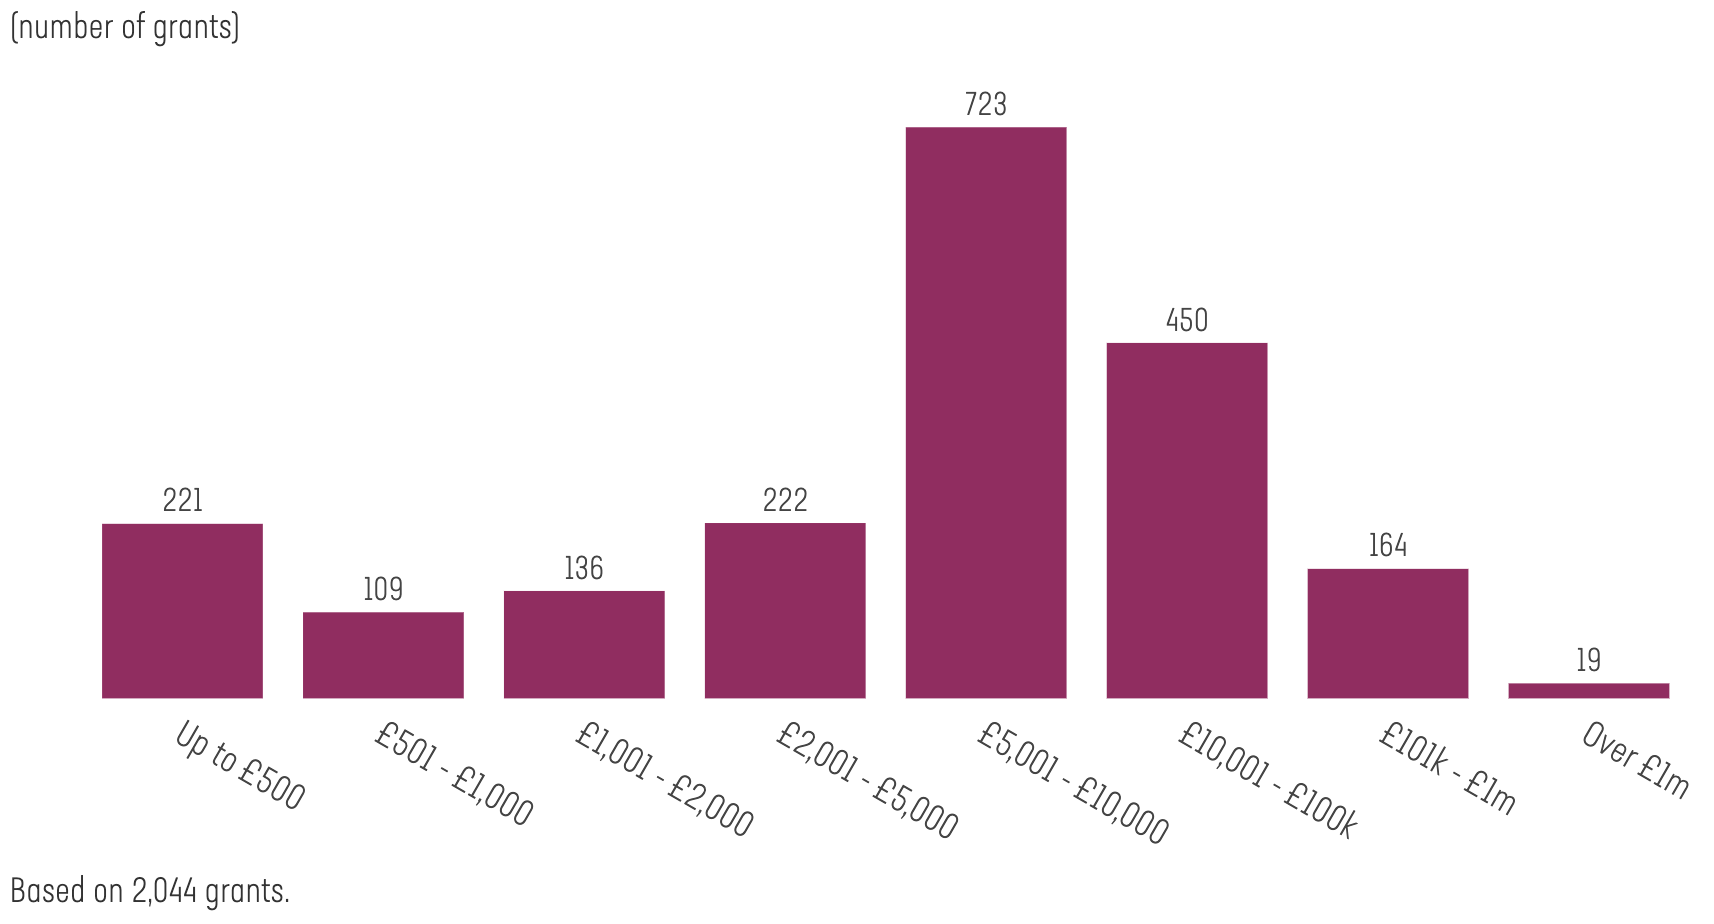
West Midlands (amount awarded)
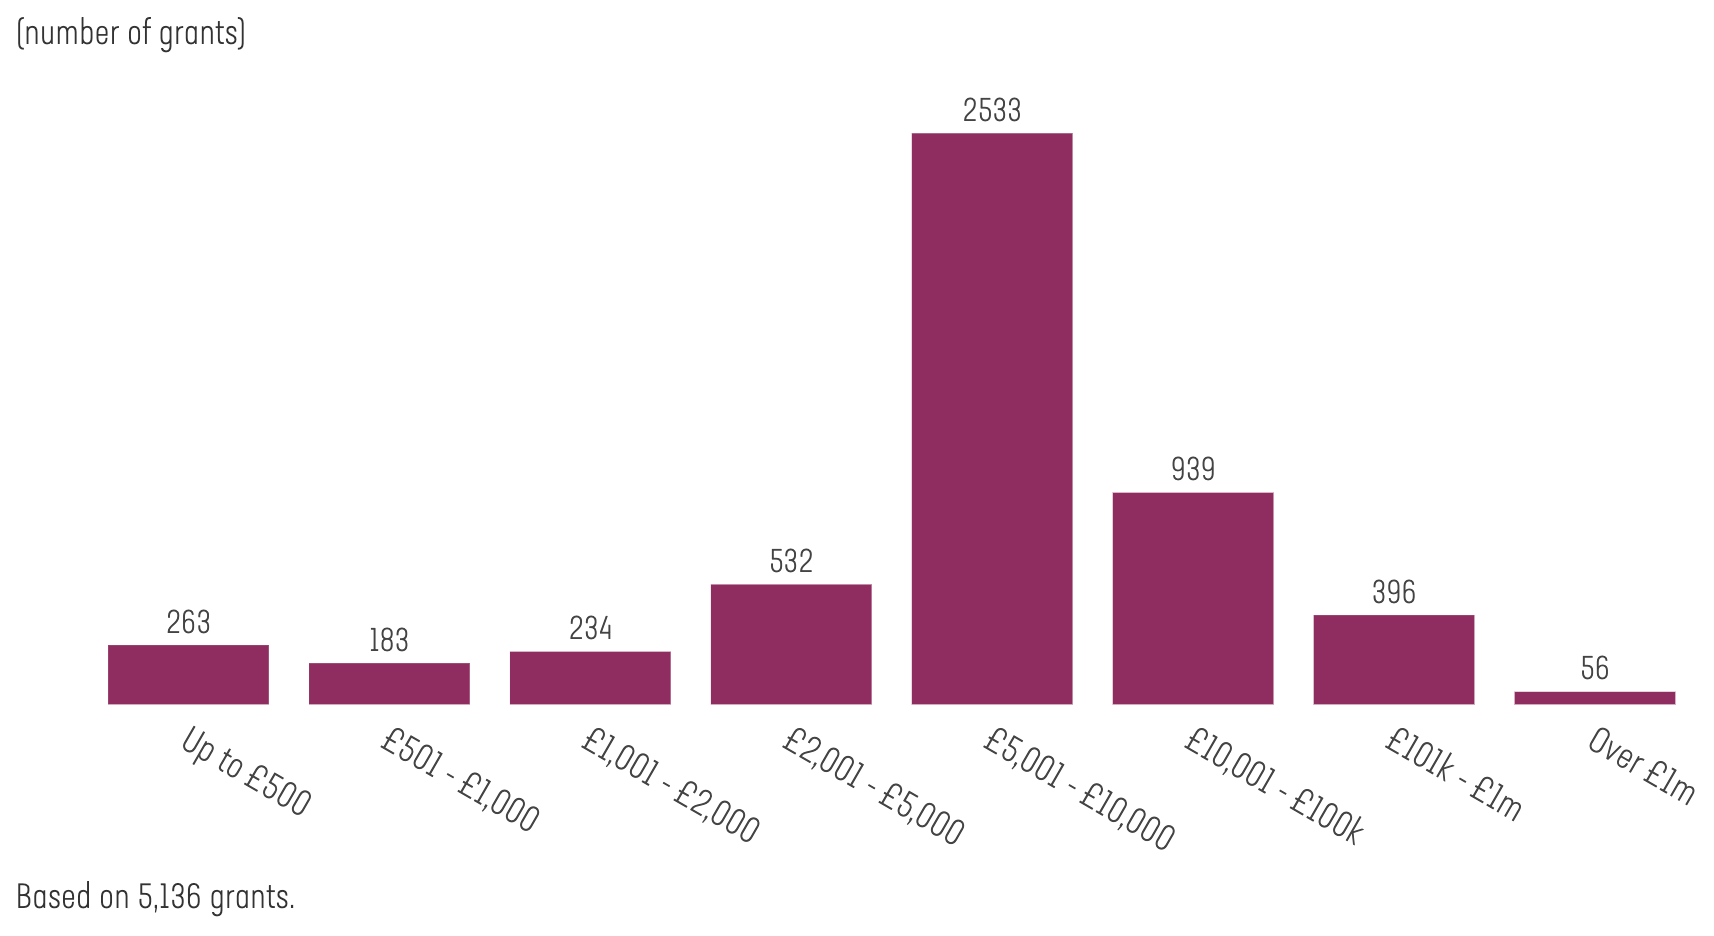
Sandwell (amount awarded)
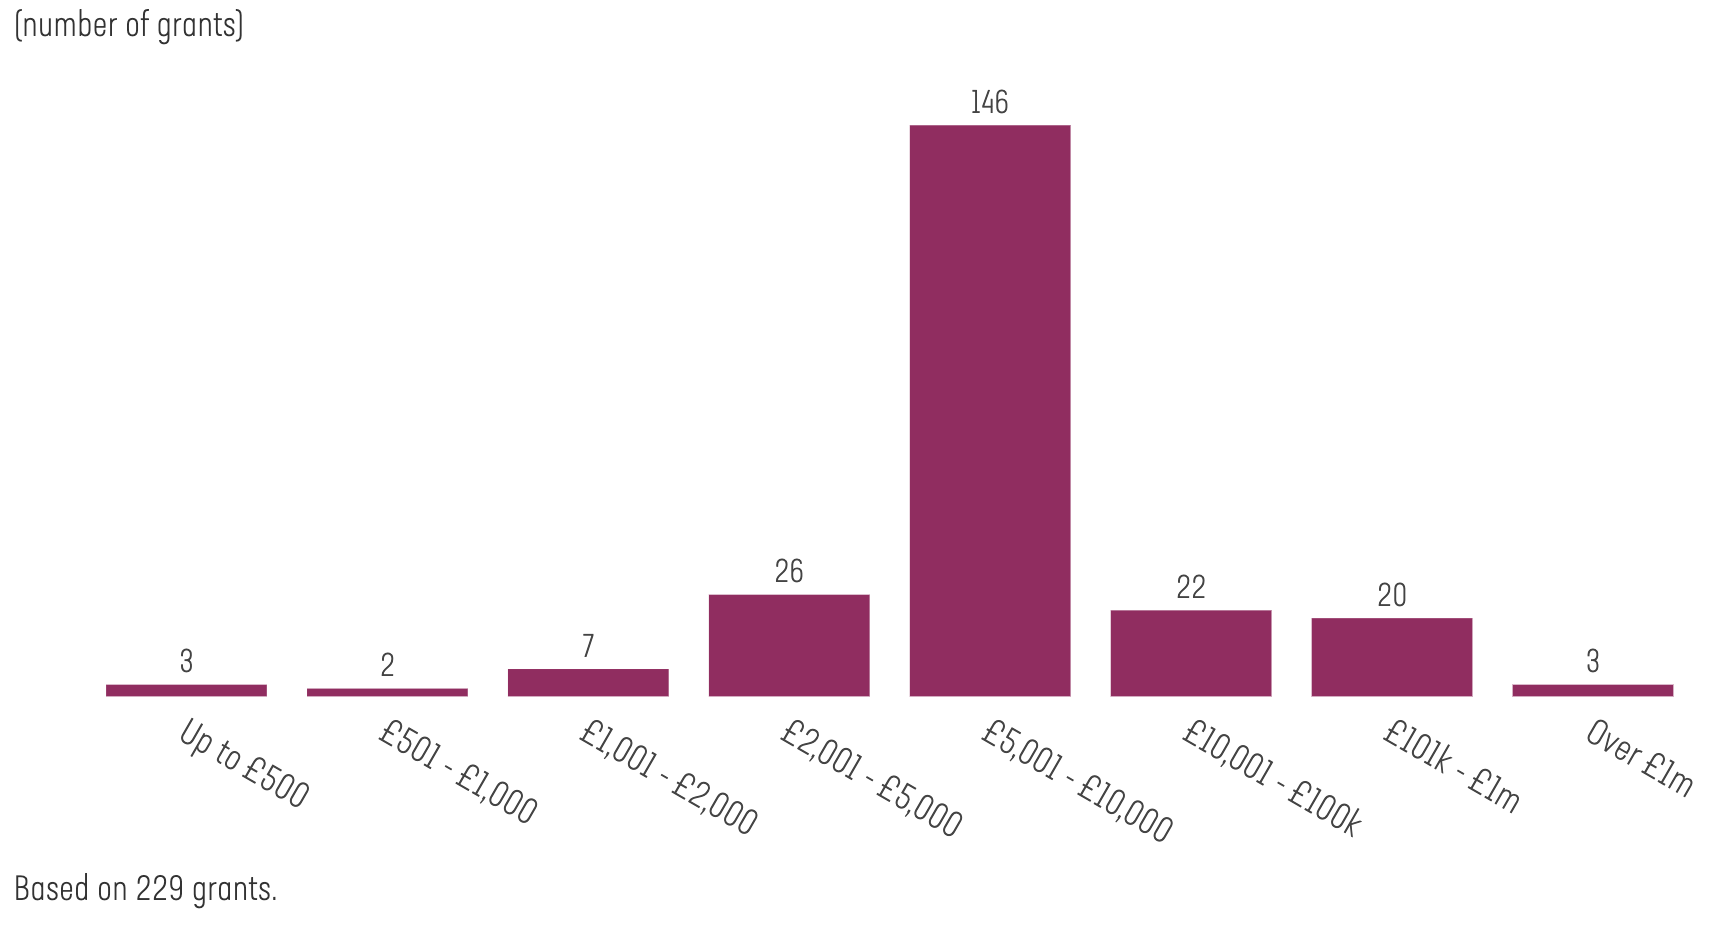
Sandwell (funders)
What we found
The graphs above show just one of the visualisations from 360Insights: number of grants awarded, arranged by amount awards. If you’d like more detail, you can use the datasets and upload them yourself in 360Insights.
Participants looked at the data in pairs and began discussing what it was telling them. There was a lot of discussion on what data was missing – the Arts Council England, for example, hasn’t yet shared its data to the 360Giving Standard. Despite that, there was surprise at how much arts funding had been applied for.
That the National Lottery Community Fund, Sport England and Birmingham City Council’s Community Chest were the biggest funders came as no surprise. It was also unsurprising to see the Birmingham District with many more grants awarded than the smaller Sandwell district. But not only did Sandwell receive fewer awards (2,047 vs 230 between 2014 and 2019), the number of smaller grants (up to £5,000) were much lower than Birmingham’s.
This posed more questions: was this because fewer grants were being applied for? Were fewer grants successful? What other factors might there be? We may not have found the answers in the session, but the conversation had been started.
Lessons learned
With the Birmingham 2022 Commonwealth Games coming up, it was important for Birmingham City Council to bring all the region’s grantmakers and funders together to dig into the data and get a sense of what grantmaking currently looks like across the region.
Thanks to 360Insights, funders were able to focus on the story rather than getting caught up in the technicalities of accessing and visualising their grants data.
It enabled conversation and helped to see where funders’ interests aligned, who was funding what and where, and what the cold spots were. It also helped the council and funders to begin thinking about taking ownership, and the potential for future collaboration.
Sam Milsom is Programme and Events Officer at Open Data Manchester. Follow @milsomsam and @opendatamcr on Twitter.