
More and better data, but can we follow the money?
 Last month NCVO launched its 2019 Civil Society Almanac, which they describe as “a treasure trove of voluntary sector data” – and it is. As NCVO’s Stuart Etherington says in his introduction, “…such dispassionate analysis is an important way of holding a mirror up to what we do”. I agree, and I’m a huge fan of the Almanac. It’s had a revamp, with more data tables and analysis; but if you’re low on time then the fast facts section is the place to get top-line figures on the sector’s size, income, spending and workforce.
I’m always surprised by the numbers, particularly for income and employees (test yourself – can you guess the figures?). Some people refer to the voluntary and community sector (VCS) as the third sector, which to me implies that its lower down in the pecking order behind business and government – the bronze medallist that’s allowed on the podium but not seen as a serious contender. But for a sector that provides services to 9/10 households and contributes £17.1bn to the UK economy, its importance and reach across society cannot be understated.
How are things looking?
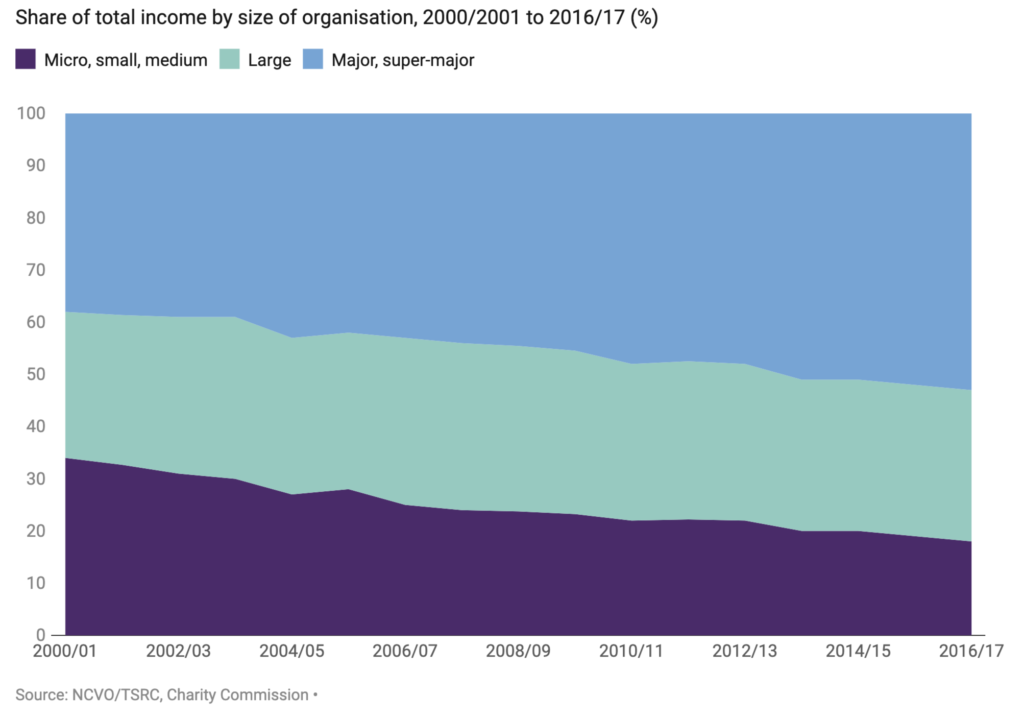
The good news is that overall sector income is up by 2% to £50.6bn. Public donations and government funding remain the largest income sources, but growth is being driven by grants and investments, with public donations falling by 2% and government income falling as a proportion of total income (to 31%). Although government provided £15.8bn of funding in 2016/17, the majority of that goes to the biggest charities and mainly as contracts rather than grants – a notable shift in recent years that has particularly affected smaller charities.
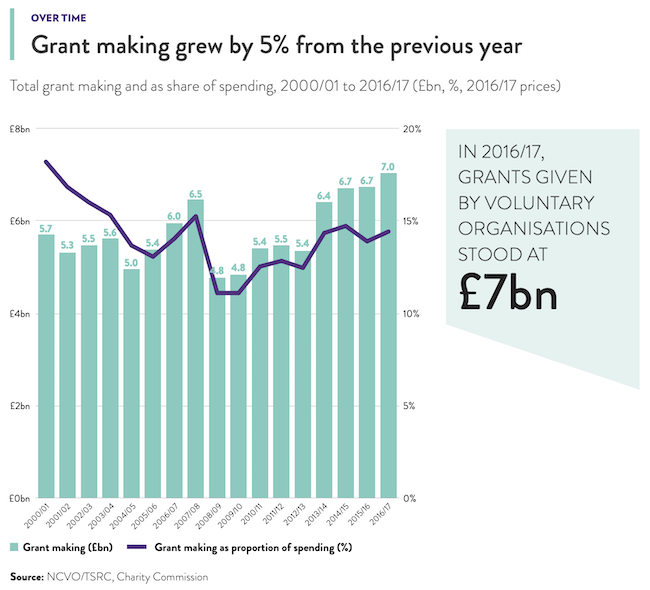 Independent grantmaking has a more positive story, with a record high of £7bn of grants awarded in 2016/17. We know from the 360Giving dataset that these grants support the full range of organisations in the sector, from the volunteer-led community groups all the way up to the biggest charities; so when it comes to ensuring the stability of the sector, the role of trusts and foundations becomes even more important. They have stepped up in a time of reduced government spending.
We’ll find out soon how that £7bn of grants breaks down by organisation with the launch of the 2019 edition of ACF’s Giving Trends. It analyses the giving, income and assets of the UK’s biggest independent foundations and is another a goldmine of data.
Following the money
But there’s a missing piece of information between these two research efforts: where did the money go? We know how much is being given to the VCS overall (although data on local authority grants remain a bit of a black hole) and we know how much voluntary organisations are spending overall, but we can’t see who is giving to what, how much and what for. As noted in the Almanac “We thought that by this point in time data collection would be far simpler. In fact, we still need to use manual methods to extract figures from charities’ annual accounts. This means we cannot go as far as we would like… However, I’m sure that will change in the future.”
Well that’s our job, and it’s something we’re committed to doing. With over 100 UK funders now sharing their grants data in an open, comparable format, it’s much easier to see and compare funding to different organisations, sectors and regions. Some central and local government organisations are also sharing their data (although we want more of it). You can search all the data here. More is being shared every month.
A substantial hole in this big picture is the grants made by central government. Cabinet Office is responsible for collecting this data from across Whitehall and releases it annually. You can find the data here. It’s all in one spreadsheet and the quality is mixed, but Government has committed to sharing it in the 360Giving format in 2019 so watch this space.
The next step is to explore how 360Giving data can complement NCVO’s and ACF’s analysis so we can see the bigger picture of grantmaking and follow the different flows of funding provided to the voluntary sector.
Seeing where individual grants went, who to and what for is key to our understanding of the sector – so do tell us what you’d like to know.
It’s more than money
And if all this is too money-oriented for you, for other insights into the sector have a read of ACF’s blog on grantmaking, endowments and climate change; NCVO’s blog on the gender pay gap; and CAF’s blog on philanthropy and inequality. All great food for thought and welcome signs of how data is contributing to a vision of UK civil society that is more informed and effective.