
A Forest of Funders
Exploring the landscape of UK grant funders through a handmade data visualisation
Last year we held a competition to celebrate how open grants data can be visualised.
In the latest in our series about the winners, Dr Cath Sleeman takes us through her physical data visualisation. A Forest of Funders won the Special Judges Award.
This blog is a longer read (9 minutes) as we feel that the story of Cath’s work is worth sharing in more depth. She explains how she created the visualisation, what it tells us and how you can create your own version.
The challenge
My visualisation was designed to answer one of the questions posed by 360Giving’s Challenge: who has funded what themes throughout the years?
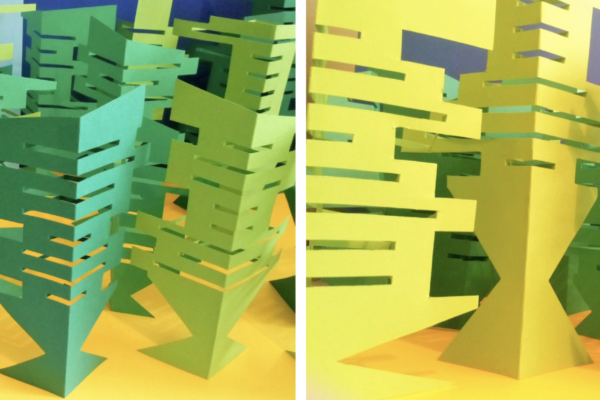
Each tree represents a funder. The features of a tree, such as its height and width, show key characteristics of the funder, such as the number of grants they have awarded and their areas of focus.
A forest of funders
In this data visualisation each tree represents a funder. There are 20 trees, one for each of the 20 largest funders. Together these organisations have awarded 98.5% of all funding recorded on the GrantNav platform (as at July 2018).
Each tree embodies four characteristics of a funder: the number of grants they have awarded and their value (which determine the shape of the tree’s base), the years of available grant data (colour of the tree), the growth in funds awarded between 2014 and 2016 (top of the tree) and the distribution of their funds across eight themes (branches of the tree).
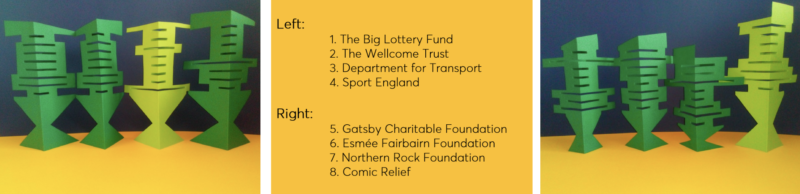
The 1st-8th largest funders
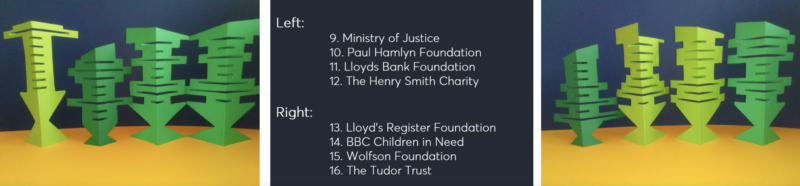
The 9th-16th largest funders

The 17th-20th largest funders, and the order of themes on the branches
The diagram below provides more detail. It includes measurements so that anyone can create their own tree. Each tree is handmade from a single piece of paper. The visualisation was inspired by observing the large variety of funders. Much like a forest of trees, each funder is unique and varies in their size, age and the themes on which they focus. The choice of paper reflects the fragile nature of the grant-giving landscape, where even large funders (such as the Northern Rock Foundation) can collapse.
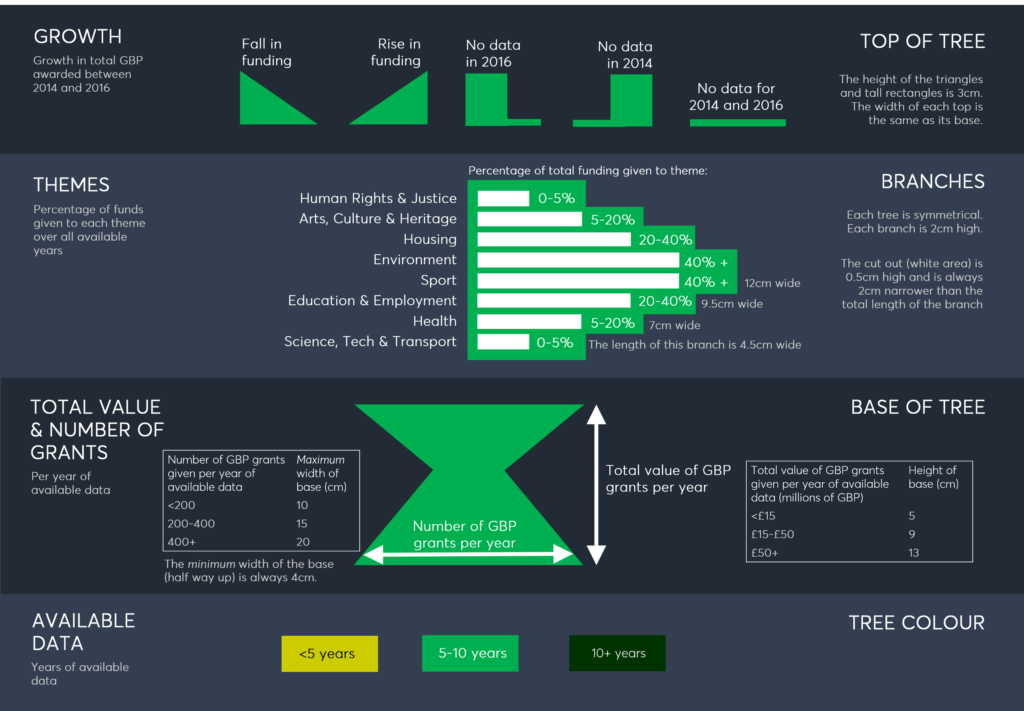
How to read a tree.
The order of the themes (or branches) on the trees reflect the total funds that have been awarded to each theme by all funders included in GrantNav. The first or lowest branch is for Science, Technology and Transport which attracted the greatest level of funding, while the top branch is for Human Rights and Justice which attracted the lowest level of funding.
Branching out from digital data visualisation
This is an example of a physical data visualisation, which is simply an object that encodes data values within its attributes. Two familiar examples of physical data visualisations are mercury thermometers and world globes. Pierre Dragicevic and Yvonne Jansen have compiled a large list of other examples.

Physical data visualisations force the creator to carefully examine the data.
While physical data visualisations are by no means new they are much less common than the digital variety. However, they can still be a highly effective communication tool, enabling data insights to be presented in a creative and accessible way.
Physical data visualisations force the creator to explore the data in detail when making or shaping the object. Exploring the data is essential to identify insights. In contrast, it is easy to create a digital chart without even looking at the data.
Physical visualisations also prevent the creator from using certain digital features that can obscure the ‘big picture’. For example, it is not possible to use drop-down menus — these require the viewer to memorise information in order to make comparisons. And it is not possible to add lots of printed numbers to a physical object — tables of printed numbers put the onus on the viewer to draw insights.
Finally, a physical data visualisation may make data feel more accessible and less intimidating to viewers, by using materials, reference points and methods that are familiar. In this case, anyone can have a go at making their own tree.
The landscape
The most striking insight is the enormous variety of trees — no two trees are the same — and this reflects the diverse nature of funders who vary in age, size, growth and focus.
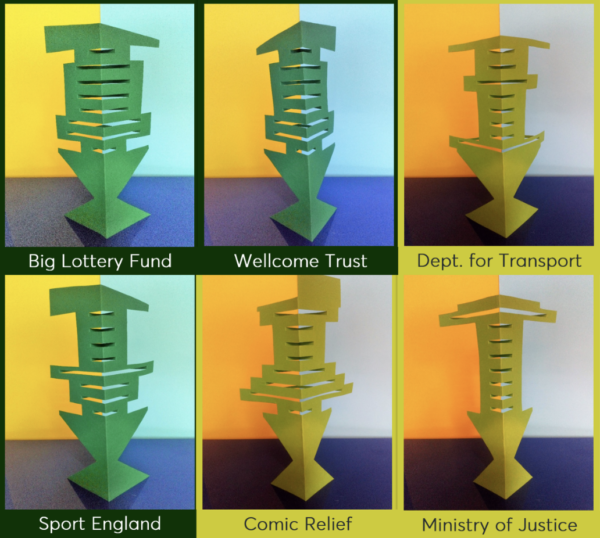
The Giants: six funders who each awarded at least £50 million per year.
Giants: The six tallest trees are for those funders who gave over £50 million per year of available data. They are the Big Lottery Fund (now The National Lottery Community Fund), the Wellcome Trust, the Department for Transport, Sport England, Comic Relief and the Ministry of Justice. Together these six funders awarded 90% of the funds captured in GrantNav up to July 2018).
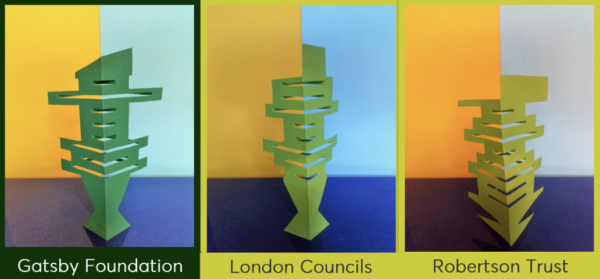
Rarities: The Gatsby Charitable Foundation and the London Councils gave a small number of large grants, while the Robertson Trust gave a relatively large number of small grants (amongst the 20 largest funders)
Rarities: The trees for the Gatsby Charitable Foundation and London Councils stand out as they have narrow bases relative to their height. That’s because both awarded a small number of very large grants, giving an average of £2.3 million and £1.4 million per grant respectively. In contrast, the tree for the Robertson Trust has a very wide but short base. The Trust awarded a large number of small grants, giving the equivalent of £29k per grant.
A mixed picture for growth: The tops of trees show the direction of growth in the value of funds awarded between 2014 and 2016. Amongst the funders who reported data in both years, half increased their funding and half cut their funding. However for many funders (including those outside the top 20) there is no grant data available for either one or both years. For this reason, the funding of themes was not compared between years.
Who has funded what themes?
Funders
Most funders spread their focus over three or four themes. However two groups took a different approach.
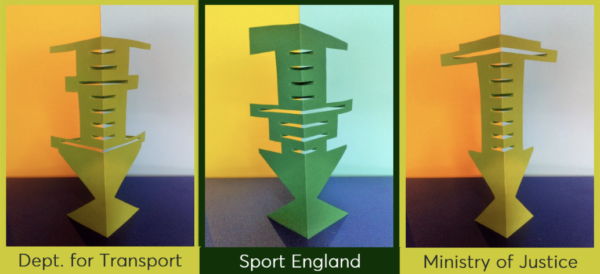
Specialist funders. The Department for Transport specialised in Science, Technology and Transport (first or lowest branch), Sport England specialised in Sport (fourth branch) and the Ministry of Justice specialised in Human Rights and Justice (eighth or highest branch)
Specialists: The Department for Transport, Sport England and the Ministry of Justice all concentrated their funding (over 80% in each case) on a single theme. Their trees each contain one branch that is particularly long. That said, a note of caution is due because the data that different organisations have shared varies in terms of periods and how frequently they update it.
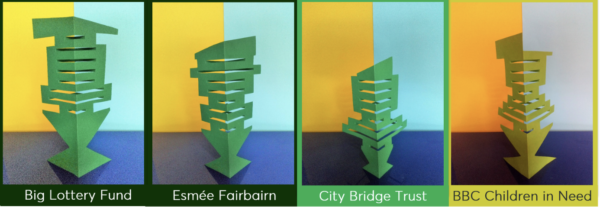
Generalist funders who each gave at least 5% of their funding to six or more of the eight themes
Generalists: Another group of funders took the opposite approach by spreading their funding over many themes. The branches of their trees are more even in length than those of the specialists. Examples include the Big Lottery Fund, the Esmée Fairbairn Foundation, City Bridge Trust and BBC Children in Need. Each gave at least 5% of their funding to six or more of the eight themes.
Themes
Science, Technology and Transport, which is the lowest branch on every tree, drew the focus of only a few large funders. Only six of the 20 funders gave more than 5% to this theme. However, among these six, all but one gave at least 20% of their funds. This may be because the 360Giving dataset includes large funders who target these themes.
Health and Education and Employment, which are represented by the second and third branches respectively, were a major focus for many funders. Four funders gave at least 40% of their funds to health-related projects: Comic Relief, the Henry Smith Charity, BBC Children in Need and City Bridge Trust. For Education and Employment, a majority of funders gave at least 20% of their funds to this theme.
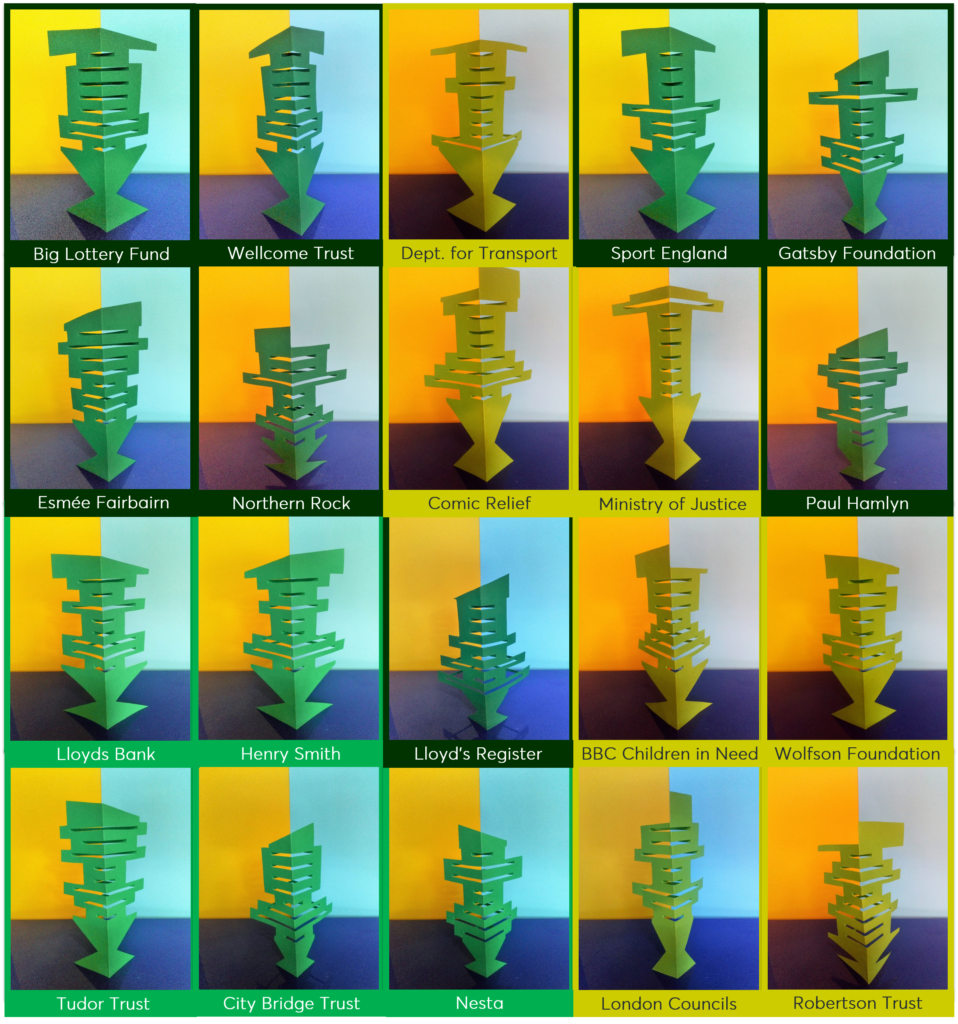
The individual trees for the 20 largest funders. They are ordered by the total value of funds awarded, from top left to bottom right
Aside from Sport England, no funder gave more than 20% of their funding to Sport (the fourth branch). Similarly, for the theme of Human Rights and Justice (the top or eighth branch), the Tudor Trust was the only organisation amongst the 20 considered (aside from the Ministry of Justice) to give at least 20% of their funding to this theme.
Housing (the sixth branch) and Arts, Culture and Heritage (the seventh branch), attracted a variety of interest levels from the 20 largest funders. Both the Esmée Fairbairn Foundation and the Gatsby Foundation gave the largest percentage of their funds to the Arts, Culture and Heritage theme, while many others gave at least 5%. For Housing, the funder who gave the single largest percentage of their funds was the, now defunct, Northern Rock Foundation. Other funders who focused on Housing include the Lloyds Bank Foundation and London Councils.
The absence of long branches for the Environment theme (the fifth branch) shows that none of the 20 funders awarded more than 20% to this theme. The Calouste Gulbenkian Foundation (34th by total funding level based on our wider analysis) is the first funder in this dataset to have given at least 20% to environmental causes.
Towards a clearer view
The results presented above are not without limitation. Below are two ideas to deliver more accurate and richer insights in the future.
How can we ensure a clearer picture in future?
The analysis above relied on keyword searches to identify the themes of grants. If funders always completed the ‘description’ field for each grant it would improve the accuracy of searches and enable methods such as topic modelling to discern the key themes. Regardless of the approach taken, it is important not to force each grant into a single category, as many grants cut across multiple themes.
Grant data for some of the largest funders was missing at the time, particularly for recent years. If funders shared their data as soon as it is available, this would enable analysts to more quickly spot themes that are more or less popular. Feeding those insights back to grant makers might allow them to take a more agile approach to funding.
Cath Sleeman
Quantitative research fellow at Nesta, specialising in data visualisation
This blog post is a shorter and edited version of Cath’s Medium article, July 2018