
Exploring community-based grants in Birmingham

As one of the biggest grant funders in Birmingham, Birmingham City Council has a responsibility to make its funding information available. What easier and better way to do this than to use the 360Giving data standard, so the Council’s grants can be explored alongside those from other funders? Thanks to a bit of help and encouragement from 360Giving’s support team, some patience with spreadsheets and support from our Cabinet Member, in October 2017 Birmingham City Council published its grant funding data for 2014-2017. This included over 1,100 grants worth £35 million. I’m preparing to publish our 2017-18 data anytime now.
As the data is made available under an open licence it means it can be included in different tools and platforms, such as GrantNav. In just three clicks it’s possible to find information that previously would have taken several weeks to collect – or been impossible to find – which is why GrantNav has become part of my essential toolkit. For example, as a commissioner for prevention and communities, I use 360 data about community-based grants to inform our place-based prevention model and investment. We’re also comparing how investment in migrants and new communities compares to other themes, concluding that we need to do far more to engage the community sector and funders in this issue. I’m even writing references to the data from GrantNav into contracts as a measure of changes to the levels of community investment, particularly in areas where we know we need to see changes.
As part of a more community-focused approach to social care and health we’re investing in Neighbourhood Network Schemes (NNS), inspired by the successful Leeds model (for more information visit https://brumnns.wordpress.com). This involves investing in community assets and activity – essentially places to go and things to do – which can benefit older people and the wider community. This is being done through micro and small grant funding for new activity and increasing the accessibility of existing activity, as well as investing in the skills and development of community groups and organisations. We’re putting £2.7 million per annum into the NNS and have high hopes of success. For a city the size of Birmingham this investment is relatively modest, so the question is how and where we can get the biggest and best impact with that funding?
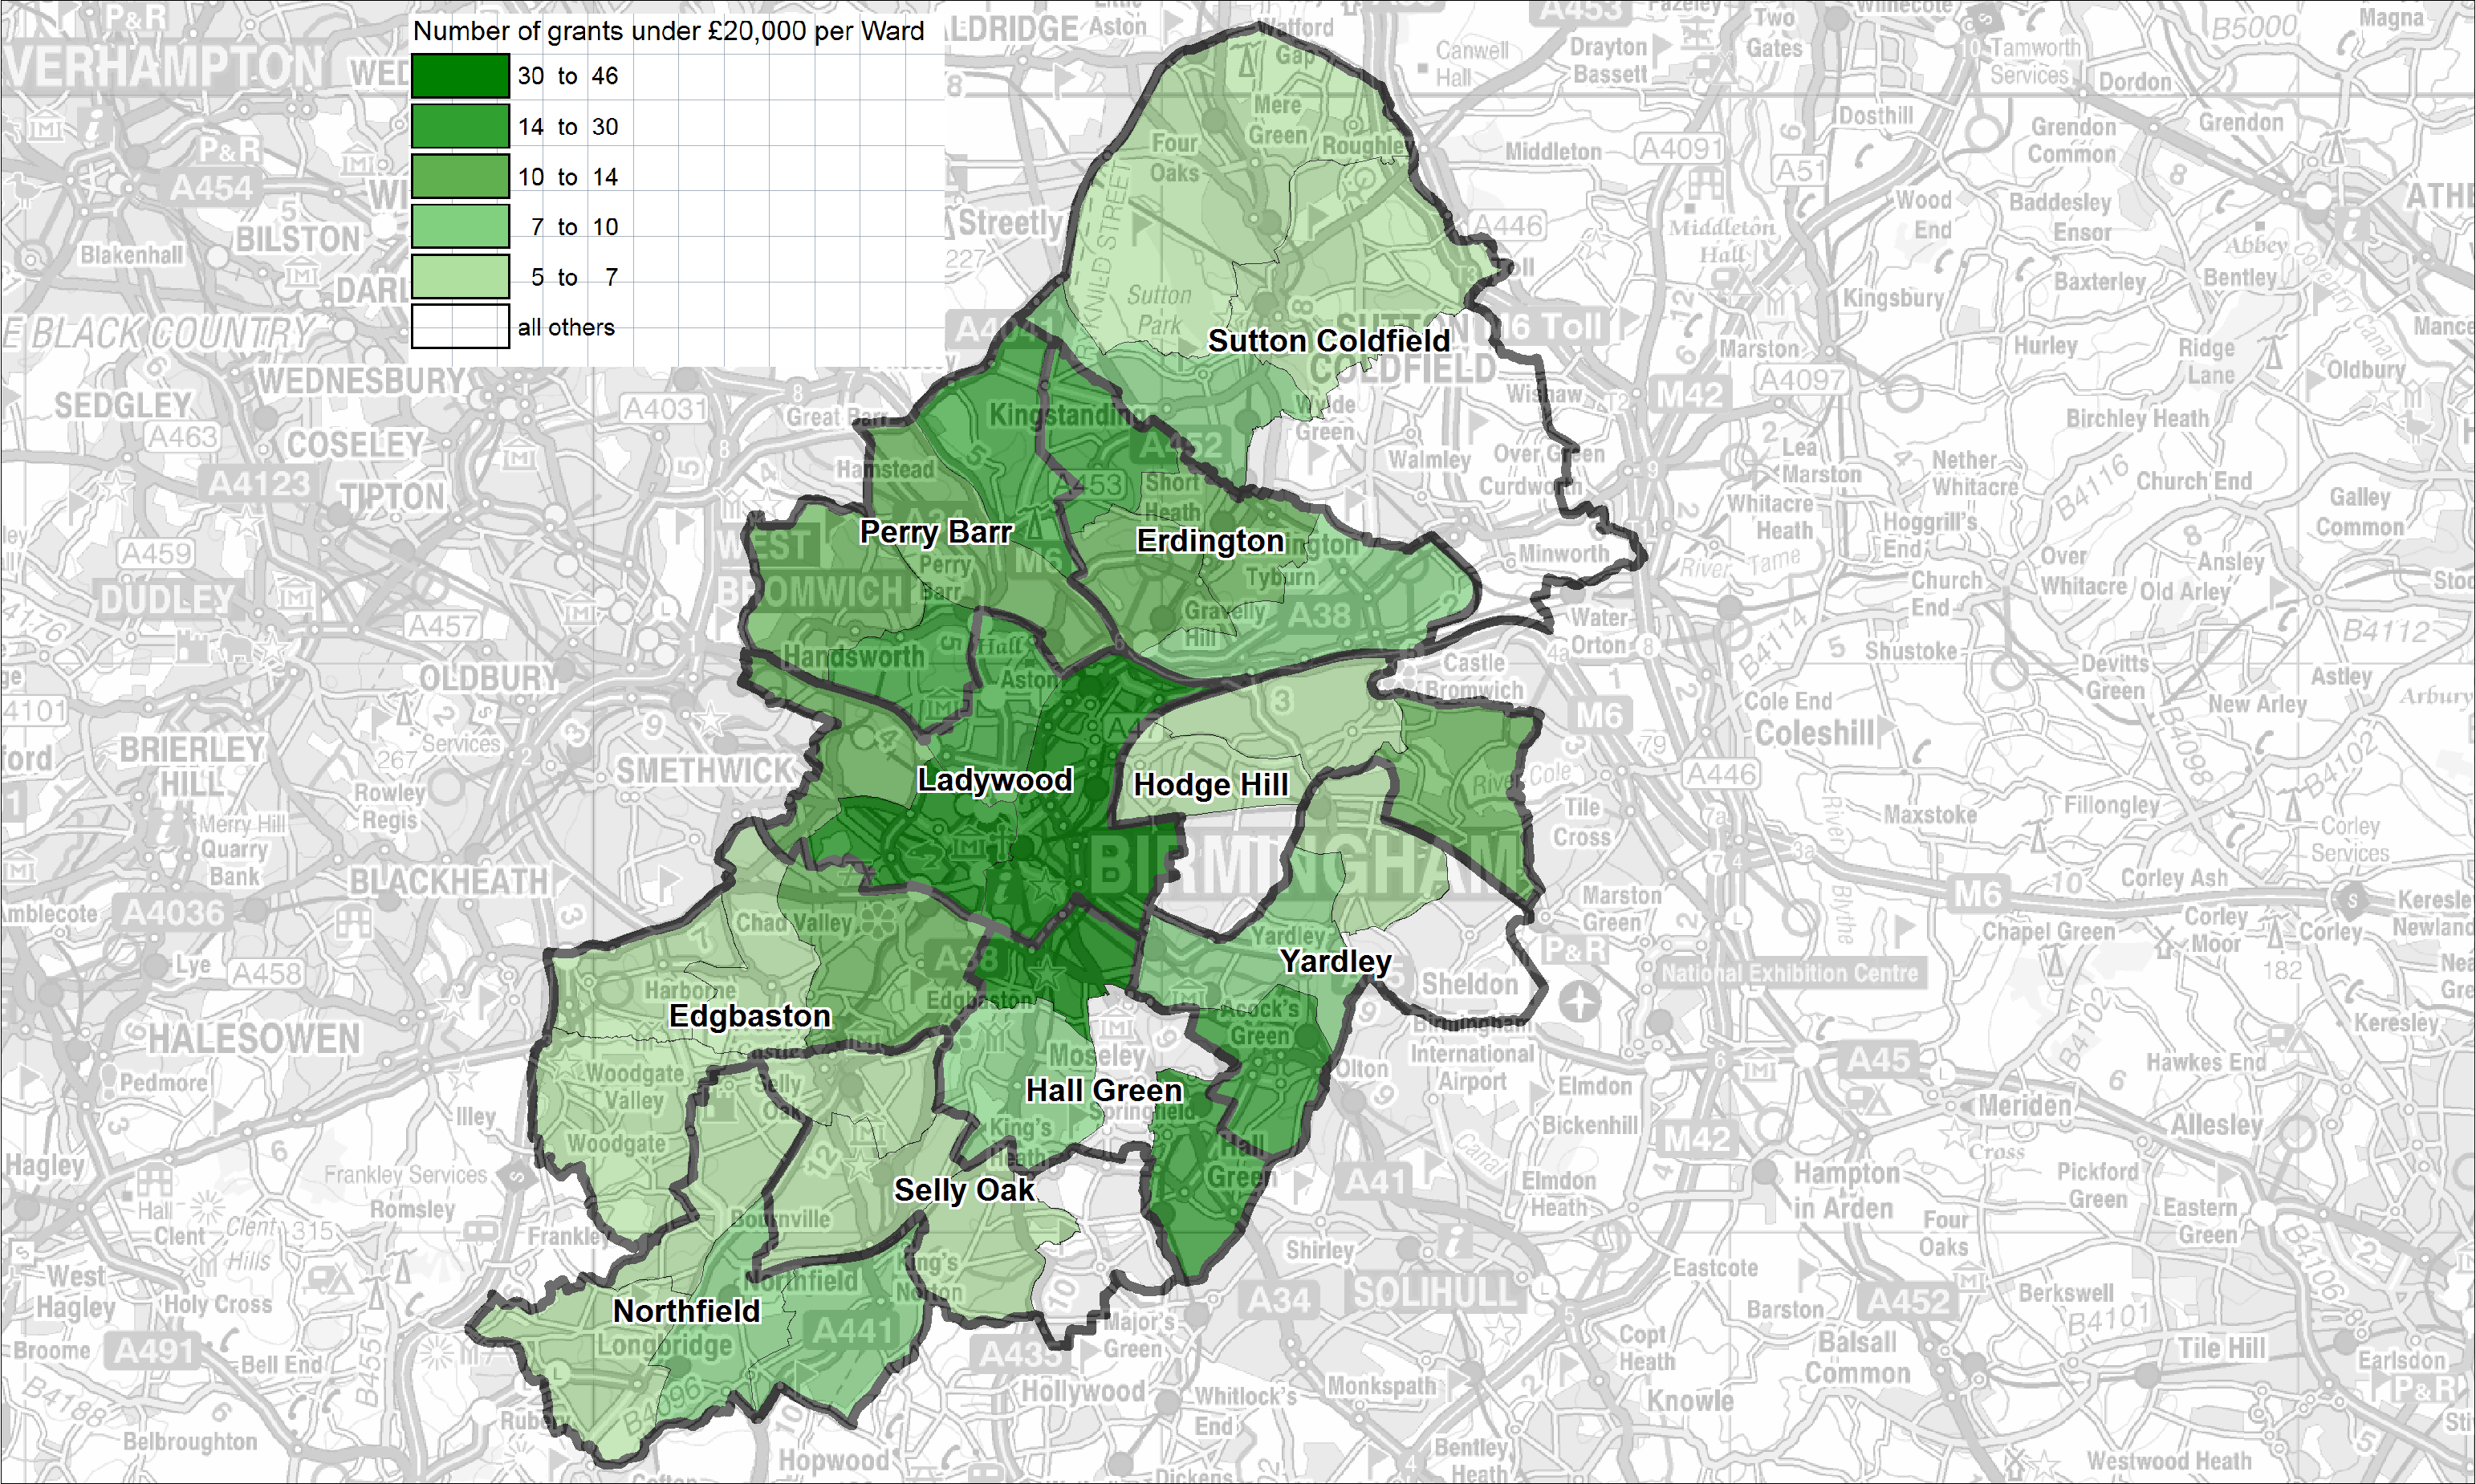
To do this we’ve looked principally at levels of demand on social care and health. To find a measure for the level of existing community activity we used 360Giving data. Our assumption is that funding fuels activity so the more groups and organisations we see receiving funding in a particular community, the more is likely to be happening there. At one end of the spectrum is a Ward where 45 groups and organisations have received grants of £10,000 or less totalling c.£300,000. At the other end are six Wards where 2-3 groups or organisations have received less than £20,000 in total. While not a perfect measure, it’s produced some interesting findings and turned some of our assumptions upside down.
We have matched this data to “social capital” and seen that some areas have far more or less than others. Going a step further we’ve added deprivation data to the mix to show that the levels of economic capital and social capital in places has a big impact on the subsequent social care and health needs of that population. The prevalence and risk of social isolation and loneliness relates to the availability and access to places to go and things to do in neighbourhoods. It means we can look beyond deprivation when assessing where best to invest, prioritising funding in those areas which are lowest for both social and economic capital and emphasising the coordination of existing resources where social or economic capital is highest. The subsequent profile of our investment looks completely different to what it might have been, and importantly it seems to make complete sense!
That’s been my journey so far, from data novice to “expert”, from looking at this type of information on the margins to it being part of day-to-day work for me and my team. It’s a journey I’d recommend to anyone looking to better understand the how, who and where of investing in neighbourhoods and communities.