
Samaritan grants and deprivation in London
In this blog series, participants in the 360Giving Data Journey share their learning and experience.

Alison Beck
Alison Beck is a grants administrator at London Catalyst, a trust tackling issues of poverty and ill-health within London. London Catalyst also administers the Samaritan Grants to assist people in emergency situations. The Samaritan grants were the focus of Alison’s data journey.
Here’s what Alison found
I participated in the Data Journey because I am keen to learn more about data analysis and how it can help our organisation to get more out of its data.
The question I focused on was: “Does the distribution pattern of Samaritan grants tally up with which areas of London are the most deprived?” I used the “average rank” from the English Indices of Multiple Deprivation to examine which London boroughs are the most deprived, and compared this with the London Catalyst Samaritan grant locations.
My biggest limitation was a lack of data on where the individual recipients of a Samaritan cash payment live. I only have data on which London borough(s) the Samaritan grant-holding organisation operates in. Due to this, the total grant amount belonging to each organisation was evenly distributed amongst all the boroughs it operates in.
What I found is that broadly speaking, our Samaritan grants are going to the areas most in need with a few less deprived areas receiving funding.
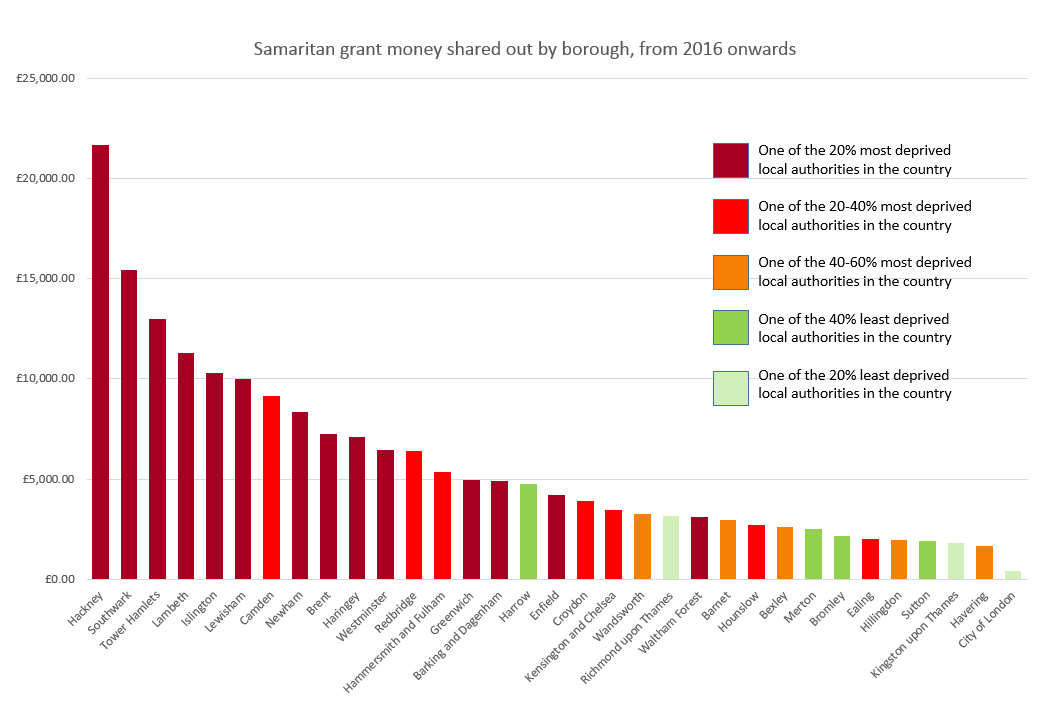
Samaritan grant money shared out by borough, from 2016 onwards
In summary
Using the “average rank” from the Indices of Multiple Deprivation is a good way to get a rough idea of how deprived an area is. However, sometimes we find a problem with boroughs: some of them have very rich and very poor areas e.g. Kensington and Chelsea, Westminster.
For example:
-
- Barking and Dagenham is the third most deprived borough in the country, but it only ranks 15th out of 33 in terms of how much Samaritan grant money we give to the borough. Should we distribute more Samaritan grants in Barking and Dagenham?
-
- Harrow isn’t a very deprived borough, but it’s getting quite a lot of Samaritan grant money. Does it have pockets of deprived areas or deprived next to affluent areas?
- Richmond-upon-Thames is one of the 20% least deprived boroughs in the country, but it’s received more Samaritan grant funding than Waltham Forest – one of the 20% most deprived boroughs. Why is this? Do more organisations in Richmond-upon-Thames know about and apply for Samaritan grants?
In the future, we could consider:
-
- Changing the way we collect data about who receives grants to give us a better idea of where the funds go.
-
- Recording this information for small areas, for example, Lower Super Output Areas (LSOA) which is the measurement used in the Indices of Multiple Deprivation.
- Analysing the variance by type of frontline organisation – how do organisations like food banks versus organisations like the Citizens Advice Bureau distribute Samaritan grants?